Funding Distribution Analysis
Objective: Gain an understanding of the Funding Distribution Analysis sample run report
The Funding Distribution Analysis displays a year-on-year funding breakdown using either total summary, treatment names, or treatment groupings for a selected Simulation.
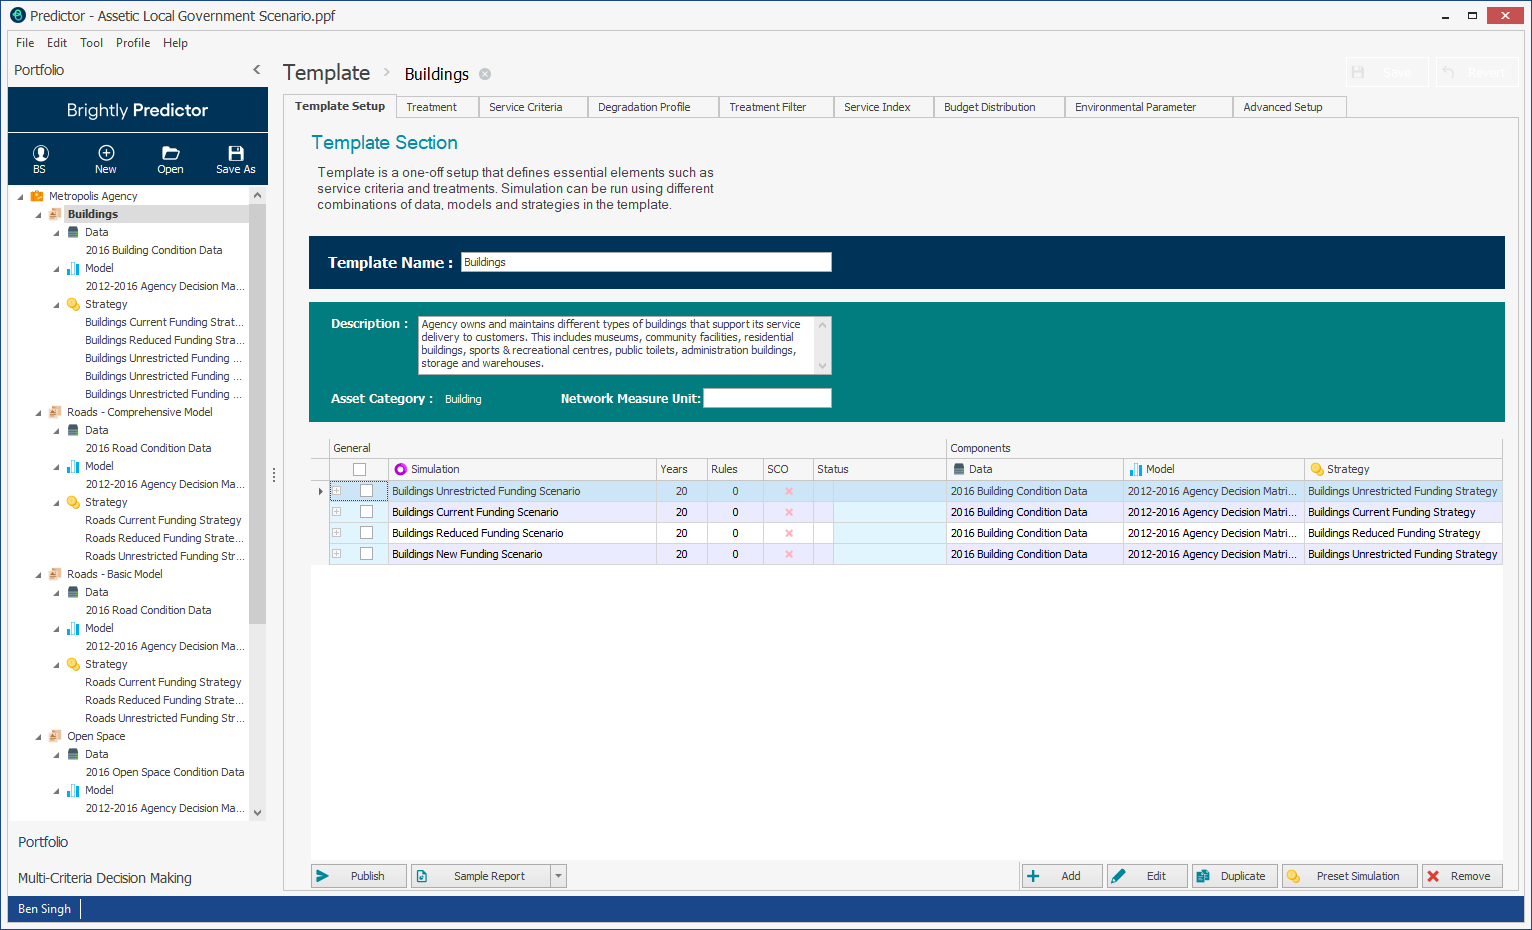
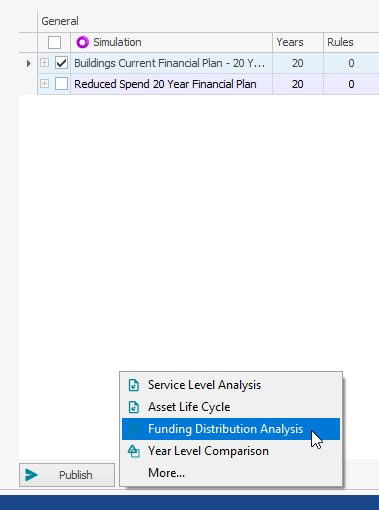
Users then select a Simulation and then click the Sample Report button to launch the Report Viewer, or alternatively, select the Funding Distribution Analysis from the Sample Report arrow to launch the report itself immediately.
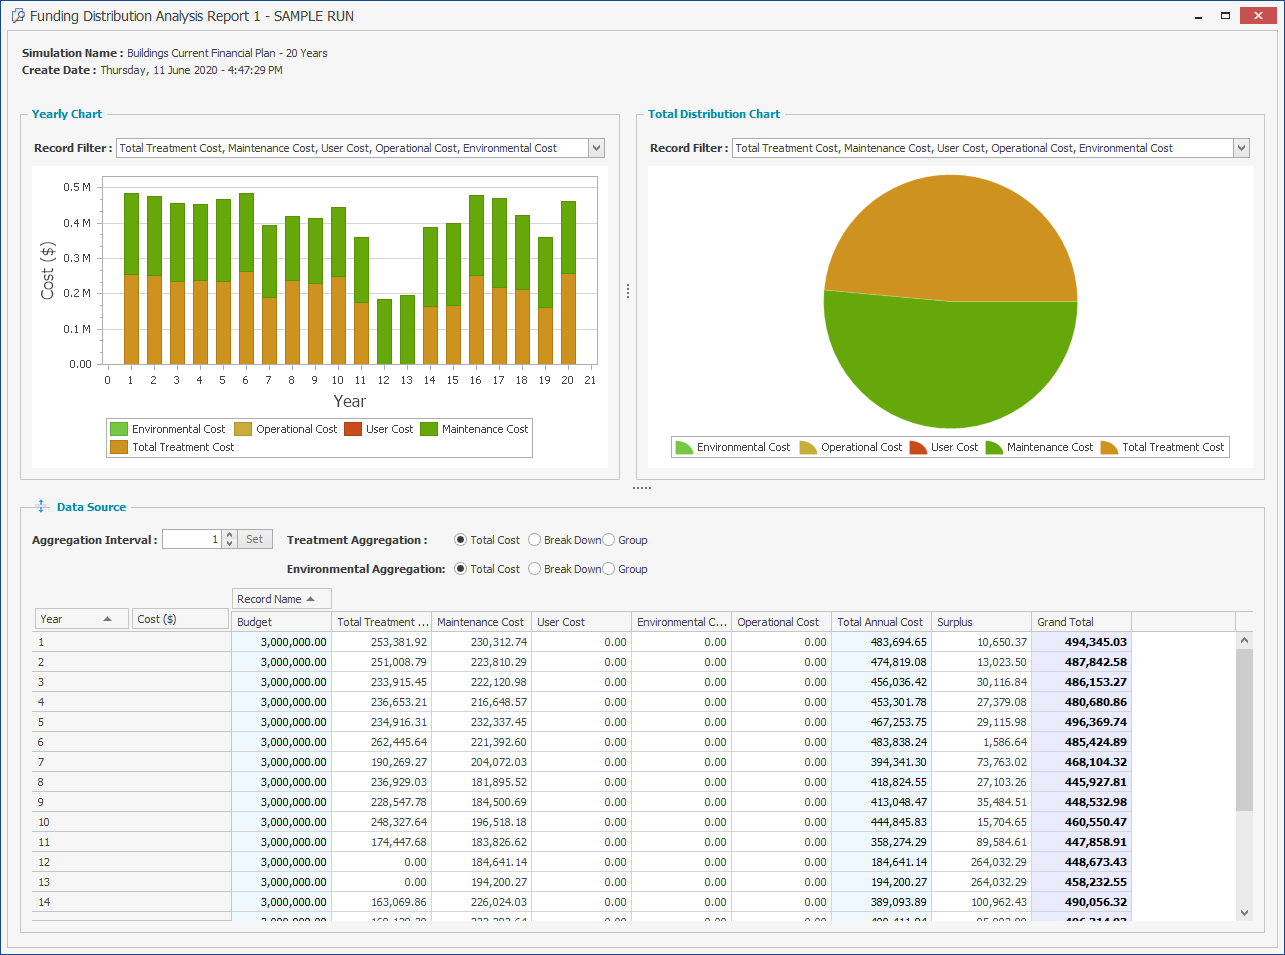
Predictor will then generate a sample run of the Funding Distribution Analysis report:
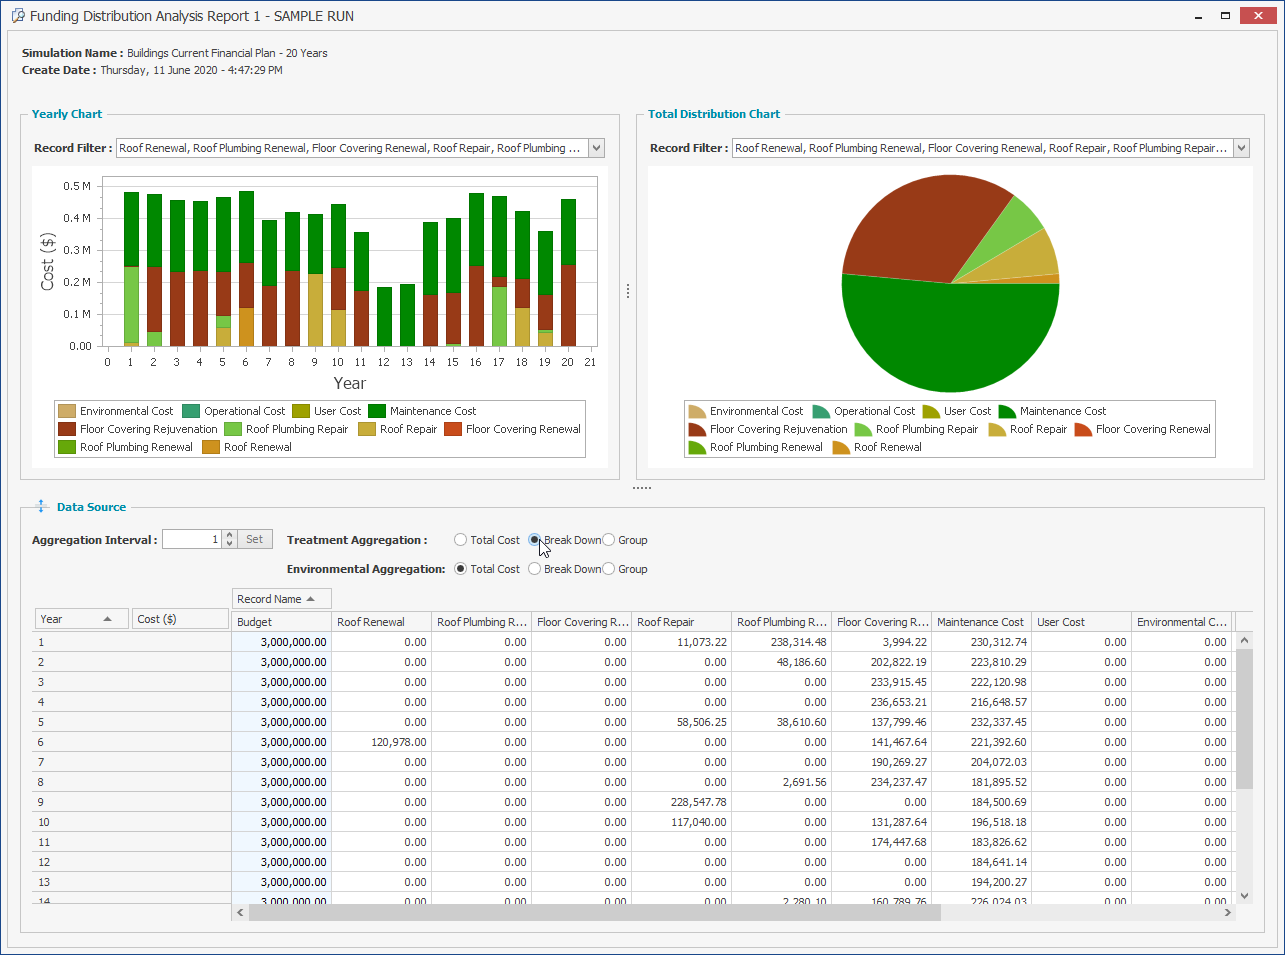
To view the breakdown of capital treatment costs and the distribution of each treatment cost in regards to the other costs, users can select the Treatment Aggregation option "Break Down" in the Data Source window:
This sample run report allows users to identify and resolve any issues with their Model, before they publish full simulation results to the Web App, where the full version of the Funding Distribution Analysis report can be viewed.
